Home
  • Careers
  • Find a retailer My retailer
  • AgConnexion
  • Choose province
    • FR
  • 0
Home
Big Menu
  • What we do
    • Livestock Production
      • Production
        See all Livestock Production
        • Front view chicken illustration
          Poultry
        • Front view beef illustration
          Beef
        • Front view horse illustration
          Equine
        • Front view dairy cow illustration
          Dairy
        • Front view swine illustration
          Swine
        • Front view sheep illustration
          Sheep, goat and specialty livestock
    • Crop Production
      • Production
        See all Crop Production
        • Illustration of a seed viewed from the side
          Seed
        • Illustration of a fertilized plant viewed from the side
          Fertilizer
        • Illustration of a farm and crops in the field
          Crop protection
    • Digital Agriculture
      • Digital Agriculture
        Platform Overview
        • Illustration of a digital ecosystem that represent the AgConnexion | Portal.
          AgConnexion | Portal
        • Illustration of a pixelated farm that represent the AgConnexion | SmartFarm.
          AgConnexion | SmartFarm
        • Illustration of a pixelated cow that represent the AgConnexion | Dairy Solution.
          AgConnexion | Dairy Solution
        • Illustration of pixelated silos that represent the AgConnexion | Grain Portal.
          AgConnexion | Grain Portal
        • Hidden node
        • AgConnexion Platform
        • Through AgConnexion, agri-advisors can
          access planning, communication and analysis tools to make their work easier and support farmers.
          Sollio Agriculture Partners
        • Our multidisciplinary team works every day to develop and improve AgConnexion, our digital platform.
          Our approach to development and innovation
    • Production
      See all Livestock Production
      • Front view chicken illustration
        Poultry
      • Front view beef illustration
        Beef
      • Front view horse illustration
        Equine
      • Front view dairy cow illustration
        Dairy
      • Front view swine illustration
        Swine
      • Front view sheep illustration
        Sheep, goat and specialty livestock
    • Production
      See all Crop Production
      • Illustration of a seed viewed from the side
        Seed
      • Illustration of a fertilized plant viewed from the side
        Fertilizer
      • Illustration of a farm and crops in the field
        Crop protection
    • Digital Agriculture
      Platform Overview
      • Illustration of a digital ecosystem that represent the AgConnexion | Portal.
        AgConnexion | Portal
      • Illustration of a pixelated farm that represent the AgConnexion | SmartFarm.
        AgConnexion | SmartFarm
      • Illustration of a pixelated cow that represent the AgConnexion | Dairy Solution.
        AgConnexion | Dairy Solution
      • Illustration of pixelated silos that represent the AgConnexion | Grain Portal.
        AgConnexion | Grain Portal
      • Hidden node
      • AgConnexion Platform
      • Through AgConnexion, agri-advisors can
        access planning, communication and analysis tools to make their work easier and support farmers.
        Sollio Agriculture Partners
      • Our multidisciplinary team works every day to develop and improve AgConnexion, our digital platform.
        Our approach to development and innovation

    Spotlight


    Corn and soybean crop fields in summer.

    Connected farms

    Digital tools to make the right decisions at the right time.

    View our articles 

    Spotlight

    A field of corn sprouts in the spring.

    Soil health

    Phytoprotection solutions adapted to the reality of each farmer.

    View our articles 

    Login

    • AgConnexion | Customer Portal 
    • AgConnexion | Retailer Portal 
    • AgConnexion | SmartFarm 
    • Questions about AgConnexion?

      Contact us 

    • Need support?

      Contact customer service 

  • Who we are
    Bringing the strength of Canada’s largest agricultural network to each and every farmer.
    • Who we are
      • What drives us
      • Our network
      • Our Executive Committee
      • Our policies
    • What drives us
    • Our network
    • Our Executive Committee
    • Our policies
    A Canadian farmer walks through a field with his little girl on his shoulders.
  • Corporate responsibility
  • My folder 0
  • Choose province
  • Careers
  • FR
The limitations of feed margin measurement indicators
Add to my folder
Share article
Breadcrumb
Add to my folder
Share article

The limitations of feed margin measurement indicators

A farmer and an agri-advisor assess forage quality and discuss new developments in dairy production.
March 18, 2021
Feed costs are a major expense on a dairy farm, so it’s normal to monitor them closely. However, due to the limitations of certain indicators, care must be taken in their interpretation if feed costs are to be properly measured.


Different indicators, different results

The table below shows four farms with margins/kg in the top group, all delivering an average of 32 litres/cow, at 4% fat and 3.2% protein, and with the same cost/MT of forage and concentrates. We can see that these two indicators (kg milk/kg concentrate ratio and average concentrate cost/MT) give us very different results because of the amount of corn silage in the rations, which ranges from 0 to 35 kg. Note that the four rations presented have comparable nutrient intakes.
 

Comparable rations depending on the quantity of corn silage (0 to 35 kg)

table of comparable rations depending on the quantity of corn silage.


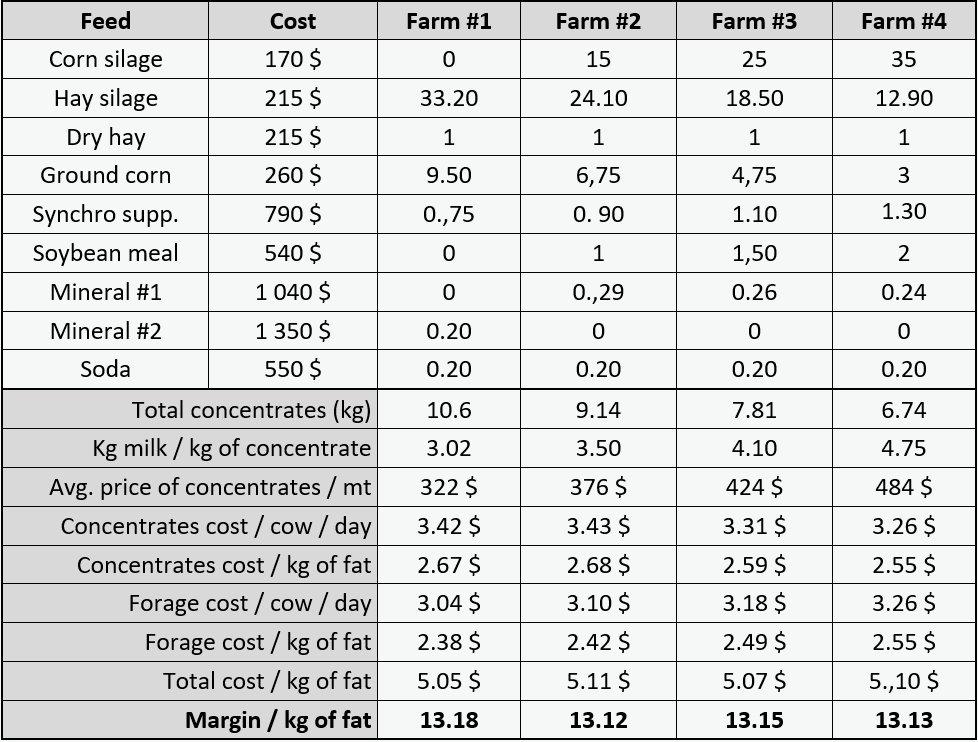
The table shows that feed costs can be measured from all angles, but the values of some indicators can vary widely from farm to farm for the same feed margin.

When using any of the indicators to make decisions, it’s important to remember that they have their limitations in terms of interpretation and comparison with others.
 

Kg milk/kg concentrate ratio

The kg milk/kg concentrate ratio, which ranges from 3.02 to 4.75, cannot be used to compare the farms. Why? Because we know that the more corn silage (which contains grain) in the ration, the less concentrates need to be added. The ratio is therefore 4.75:1 on Farm #4 and 3.02:1 on Farm #1. This difference is significant but does not affect the margin/kg of fat, which is about the same for all four farms.

As such, this indicator cannot be used to compare the farms because, as mentioned above, the rations do not contain the same amounts of corn silage. The ratio is not a measure of profitability, but rather an indicator of the type and quality of the forage provided.

If the margin/kg of fat is below expectations or targets, you need to look further to see if the problem is the revenue/kg, due to the milk components, or if the problem is that the cost/kg is too high, and then identify where it is coming from.
 

Average concentrate cost/MT

Let’s see if the average concentrate cost/MT is a reliable indicator. We can see that Farm #1 has an average concentrate cost of $322/MT, while Farm #4 has an average concentrate cost of $484/MT. The difference is $162/MT, yet these two farms have the same margin.

So, this indicator cannot be used to compare farms and draw conclusions. The two farms do not buy the same items to complete their forage rations. Farm #1 needs mainly energy, i.e., grain corn, while Farm #4, which uses a great deal of corn silage, needs protein. Farm #4 will still need to supplement its ration with concentrates, which are more expensive per tonne, but it will need fewer tonnes.

Note that these farms all pay the same price/MT for their inputs, but their average concentrate cost/MT is very different.

The point of the above example is to show you that comparing kg milk/kg concentrate ratios or average concentrate costs/MT that have very different values can distort your decision making.
 

How to accurately measure feed margins

Since 2012, with the monthly table and now AgConnexion │ Lactascan, Sollio Agriculture uses the margin/kg to measure feed margins. The formula to remember is to take the kilos of fat from the quota obtained and multiply this figure by the best possible margin/kg. The other data are indicators that can help you find out why the revenue/kg or cost/kg is higher or lower than expected.

The margin/kg herd is strongly influenced by productivity. Farms with 1.20, 1.35 or 1.50 kg of fat delivered/cow may have the same feed margin/kg for lactating cows, but they end up with very different herd margins after feeding replacement cows.

For example, delivering 100 kg of fat with cows at 1.20 kg/day instead of 1.50 kg/day will require 25% more cows, not including the associated costs. In addition, the higher requirements (land, buildings, labour) for the replacement cows can be very expensive and are not included in the feed costs for lactating cows. So the kg of fat delivered/cow must be part of the equation.

As for the forage prices, we used standardized prices to compare them. However, if we were to use actual prices, in many cases we would adopt a strategy to reduce the forage cost/kg of fat delivered. You can obtain your feed margin report via AgConnexion │ Lactascan or a daily overview. Ask your agri-advisor about this.


Source: This article was originally published in French in the March 2021 issue of Coopérateur magazine.


About the author

Nicolas Marquis, advisor in agribusiness strategy for the dairy sector

Nicolas
Marquis

Nicolas Marquis is a technical-economic expert for the dairy sector. He graduated from the Institut de technologie agroalimentaire du Québec, La Pocatière campus, and has over 30 years of experience working for Sollio Agriculture.

Add to my folder
Share article

Keep reading

A Dairy farmer and a Sollio Agriculture's agri-advisor analyze the forage.

Personalized support

Our agri-advisors are always there when you need feed recommendations, herd management advice and innovative solutions.
Contact an agri-advisor
Sollio Agriculture logo
Menu Footer Sollio Principal
  • Livestock production
  • Careers
  • Crop production
  • Media
  • Digital agriculture
  • Donation and sponsorship
  • Find a retailer
  • Contact Sollio Agriculture
Footer Social Medias
  • YouTube
    Logo YouTube
  • Facebook
    Logo Facebook
  • Instagram
    Logo Instagram
  • LinkedIn
    Logo LinkedIn
  • Twitter
    Logo Twitter
Menu Footer Sollio inferieur
  • Cookie Manager
  • Terms of Use
  • Privacy Class Action
© 2025 Sollio Agriculture. All rights reserved.

Search

Search Suggestions:

AgConnexion
Digital Agriculture
Research Farm
Careers
AgConnexion
  • Login
  • Customer Portal
  • Retailer Portal
  • SmartFarm
  • Questions about AgConnexion?
    Contact us
  • Need support?
    Contact customer service
My folder

Use your folder to save content for later.

Share my folder(0)
URL copied
Choose province

Choose your province so we can show you content that matters to you.

My retailer

Name of selected retailer

Find another retailer

Login

AgConnexion | SmartFarm
Fields followed by * are required.

Please provide your email address.

Please enter your password.

Forgot your password? Contact us